

Case Study
Tuesday, October 28, 2025
We analyzed 100 AI-assisted startups: How small teams are shipping 1.8× faster

Executive summary
We reviewed 70 responses from early-stage teams using AI in their product and development workflows. The pattern is consistent. Small teams are converting AI into output.
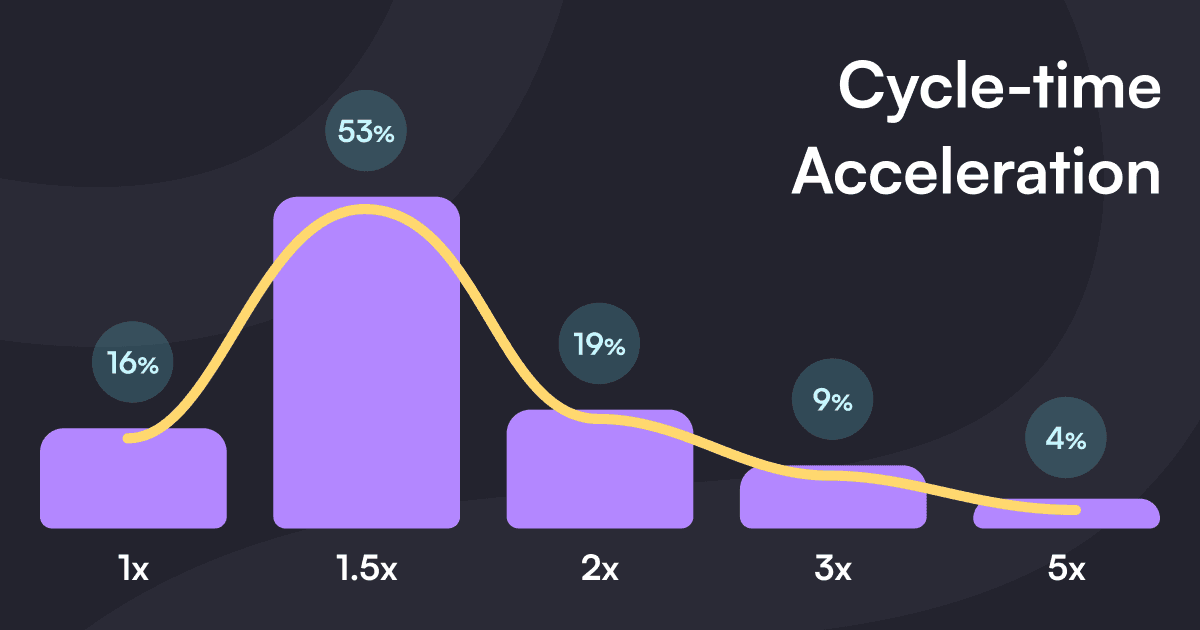
Average cycle-time acceleration: 1.79×
Median acceleration: 1.5×
Distribution: 53% at 1.5×, 19% at 2×, 9% at 3×, 4% at 5×, 16% no change
Teams reporting more frequent deployments: 17%
Teams reporting shorter release cycles: 24%
Top benefits: Coding (46%), Testing (29%), Docs (29%)
Biggest challenge: Integrating with existing systems (55%)
AI isn’t replacing engineers. It is removing drag. The teams that win pair AI with tight feedback loops, standardized prompts, and human-in-the-loop QA.
Methodology
Sample: 70 complete responses
Roles: founders, CTOs, product leads, lead engineers
Team size mix: 11% solo, 13% 2–5, 20% 6–10, 24% 11–25, 19% 26–50, 13% 51+
Stage: 24% pre-launch, 23% live product pre-funding, 27% seed/angel, 26% Series A+
AI definition: use in planning, coding, testing, docs, release, support, or analytics
Cleaning: removed partials and normalized multi-select fields. Some respondents marked “not using AI” while reporting minor acceleration. We retained their answers and flagged this as a self-report inconsistency.
Finding 1: Release cycles compressed
Teams reported meaningful drops in cycle time after adopting AI.
Average acceleration: 1.79×
Median acceleration: 1.5×
Distribution: 53% at 1.5×, 19% at 2×, 9% at 3×, 4% at 5×, 16% no change
“We went from shipping every 2 months to every 3 weeks.” — CTO, B2B vertical SaaS
Why this happens: copilots cut boilerplate, AI test generators de-risk refactors, and auto-generated docs keep releases from stalling.
Finding 2: Output per developer increased
With the same headcount, teams shipped more.
25% increased output per developer
19% started hiring AI-focused roles
17% reduced reliance on contractors
15% delayed or reduced hiring
41% reported no staffing change yet
This is time reallocation, not wholesale replacement.
Finding 3. Biggest wins landed in coding, testing, and documentation
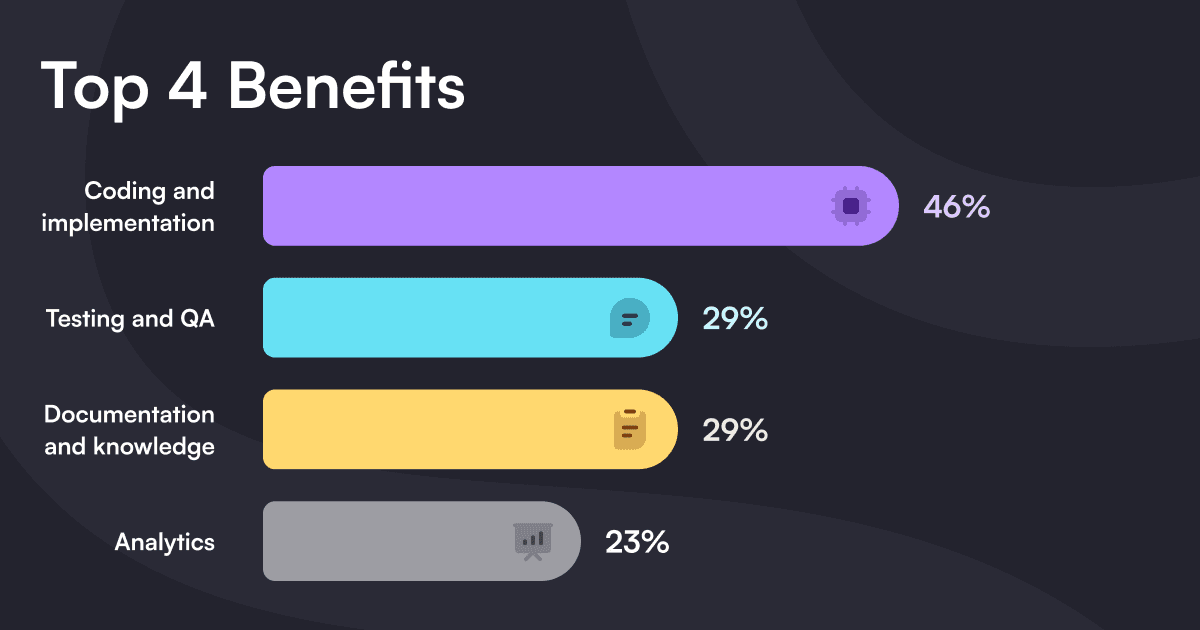
Respondents picked up to three areas where AI helped most:
Coding and implementation: 46%
Testing and QA: 29%
Documentation and knowledge: 29%
Analytics: 23%
Product or UX design: 21%
Customer support: 20%
Release management: 1%
Third-party API integrations: 1%
Pattern in comments: AI plus API-first services compresses integration work so teams focus on business logic.
Finding 4: Speed without discipline creates rework
Acceleration came with tradeoffs. Top challenges:
Integrating with existing systems: 55%
Hallucinated code: 11%
Compliance or IP risks: 10%
Unclear ROI: 7%
Data privacy concerns: 6%
QA overhead: 6%
Cost of tools: 1%
Getting started / foundational knowledge: 3%
“Velocity jumped, then rework did too until we added human QA gates.” — Head of Engineering, HR/Compliance SaaS
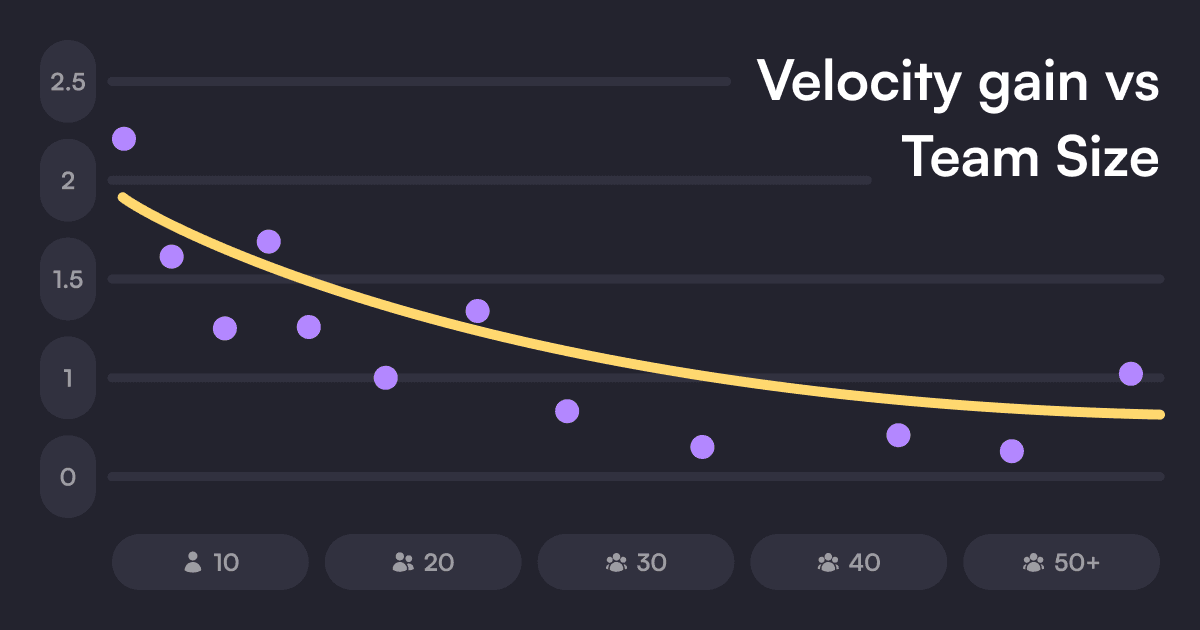
Patterns by team size and stage
Solo builders reported the sharpest perceived gains, with the most variance and rework.
Teams of 2–10 showed the most consistent net productivity lift.
11–50 still gained, but bottlenecks shifted to integration discipline and QA depth.
Seed vs Series A+: Seed teams experimented more broadly. A+ teams emphasized policy, standard prompts, and measurable QA.
How teams actually build with AI: the working stack
Lean teams adopt a build less, integrate more mindset. AI accelerates the connective tissue while APIs handle heavy lifts.
Layer | Example tools | Where AI helps | Typical output |
|---|---|---|---|
Planning | Notion AI, ChatGPT, Claude | Draft PRDs, user stories, acceptance criteria | Usable PRD in minutes |
Coding | GitHub Copilot, Cursor | Boilerplate, adapters, refactors | Faster scaffolding |
Testing | Codium, test generators | Unit and mutation tests | Wider coverage |
Docs | Generators for changelogs and summaries | Changelogs, comments, release notes | Docs that match the code |
Integration | Payments, auth, e-sign, analytics APIs | Glue code, SDK wiring, test data | Weekend integrations |
What high-velocity teams do differently
Measure
Use a simple metric and track it weekly.
Build Velocity = features released divided by developer hours invested
Standardize prompts
Reusable snippets for test generation, refactor plans, and docs. Store them next to code. Review prompts like code.
Keep a human in the loop
QA gates for security-sensitive areas. Linters, static analysis, small PRs.
Integrate, don’t reinvent
Adopt API-first building blocks for non-core capabilities. It shortens time to value and reduces maintenance.
Risks and responsible adoption
Quality drift and subtle errors. Pair AI with tests and code review.
Privacy and data protection. Treat data governance as a product requirement.
Compliance and legal alignment. Map SOC 2, ISO 27001, HIPAA, GDPR boundaries where relevant.
IP clarity. Document your model and data exposure policies.
Team trust. Make it explicit when AI is advisory versus authoritative.
Measure your own velocity
Use the free Build Velocity Template to baseline now and re-measure 2–4 weeks after AI adoption. Track:
Features released
Developer hours invested
Defects pre-release vs post-release
Mean time to review and merge
Conclusion
AI is leverage, not strategy. The teams in this dataset win by running a disciplined loop: measure, integrate, standardize, review. Do more of the work that moves the product and automate the rest.
Next steps
Run a 2-week velocity experiment with the template
Share your results to inform the next edition
Explore API-first building blocks for non-core work like auth, payments, analytics, and e-signature
Appendix A. Survey questions
Q: What's your role?
A: Founder / CEO, CTO / Head of Engineering, Product Lead, Product Lead.Q: How big is your product or engineering team?
A: Solo, 2-5, 6-10, 11-25, 26-50, 51+Q: What stage are you currently at?
A: Pre-launch, Live product, pre-funding, Seed / Angel funded, Series A or higher.Q: Which best describes your product?
A: SaaS / developer tool, Consumer productivity app, Health or compliance software, Fintech / payments, OtherQ: Where are you using AI in your workflow?
A: Code generation (e.g., Copilot, Cursor, Replit AI), testing / QA automation, documentation or changelog writing, product design or prototyping, customer support automation, analytics / summarization, not currently using AI.Q: Roughly how much faster is your team shipping with AI?
A: Slower in some cases, no noticeable change, about 1.5× faster, about 2× faster, about 3× faster, about 5× faster, more than 5× faster.Q: How has AI changed your hiring or staffing plans?
A: No change, delayed or reduced hiring plans, reduced reliance on contractors, increased output per developer, started hiring AI-focused roles.Q: Which areas of your workflow benefit most from?
A: Coding and implementation, testing & QA, documentation & knowledge sharing, release management, integration with third-party APIs, product or UX design.Q: What measurable outcomes have you seen since adopting AI?
A: Shorter release cycles, fewer bugs or regressions, more frequent deployments, faster onboarding of new developers, better documentation consistency, none yet.Q: What's been your biggest challenge with AI-assisted development?
Q: If you could give one piece of advice to other teams adopting AI, what would it be?
Appendix B. Data notes
This sample includes 18.6% respondents who marked “not currently using AI.” A portion of those also reported 1.5× acceleration, which we attribute to early experimentation, team perception, or misclassification. We retained their responses and call this out as a caveat.
Related articles
Our platform is designed to empower businesses of all sizes to work smarter and achieve their goals with confidence.


